About

Our web-based application makes trade statistics accessible:

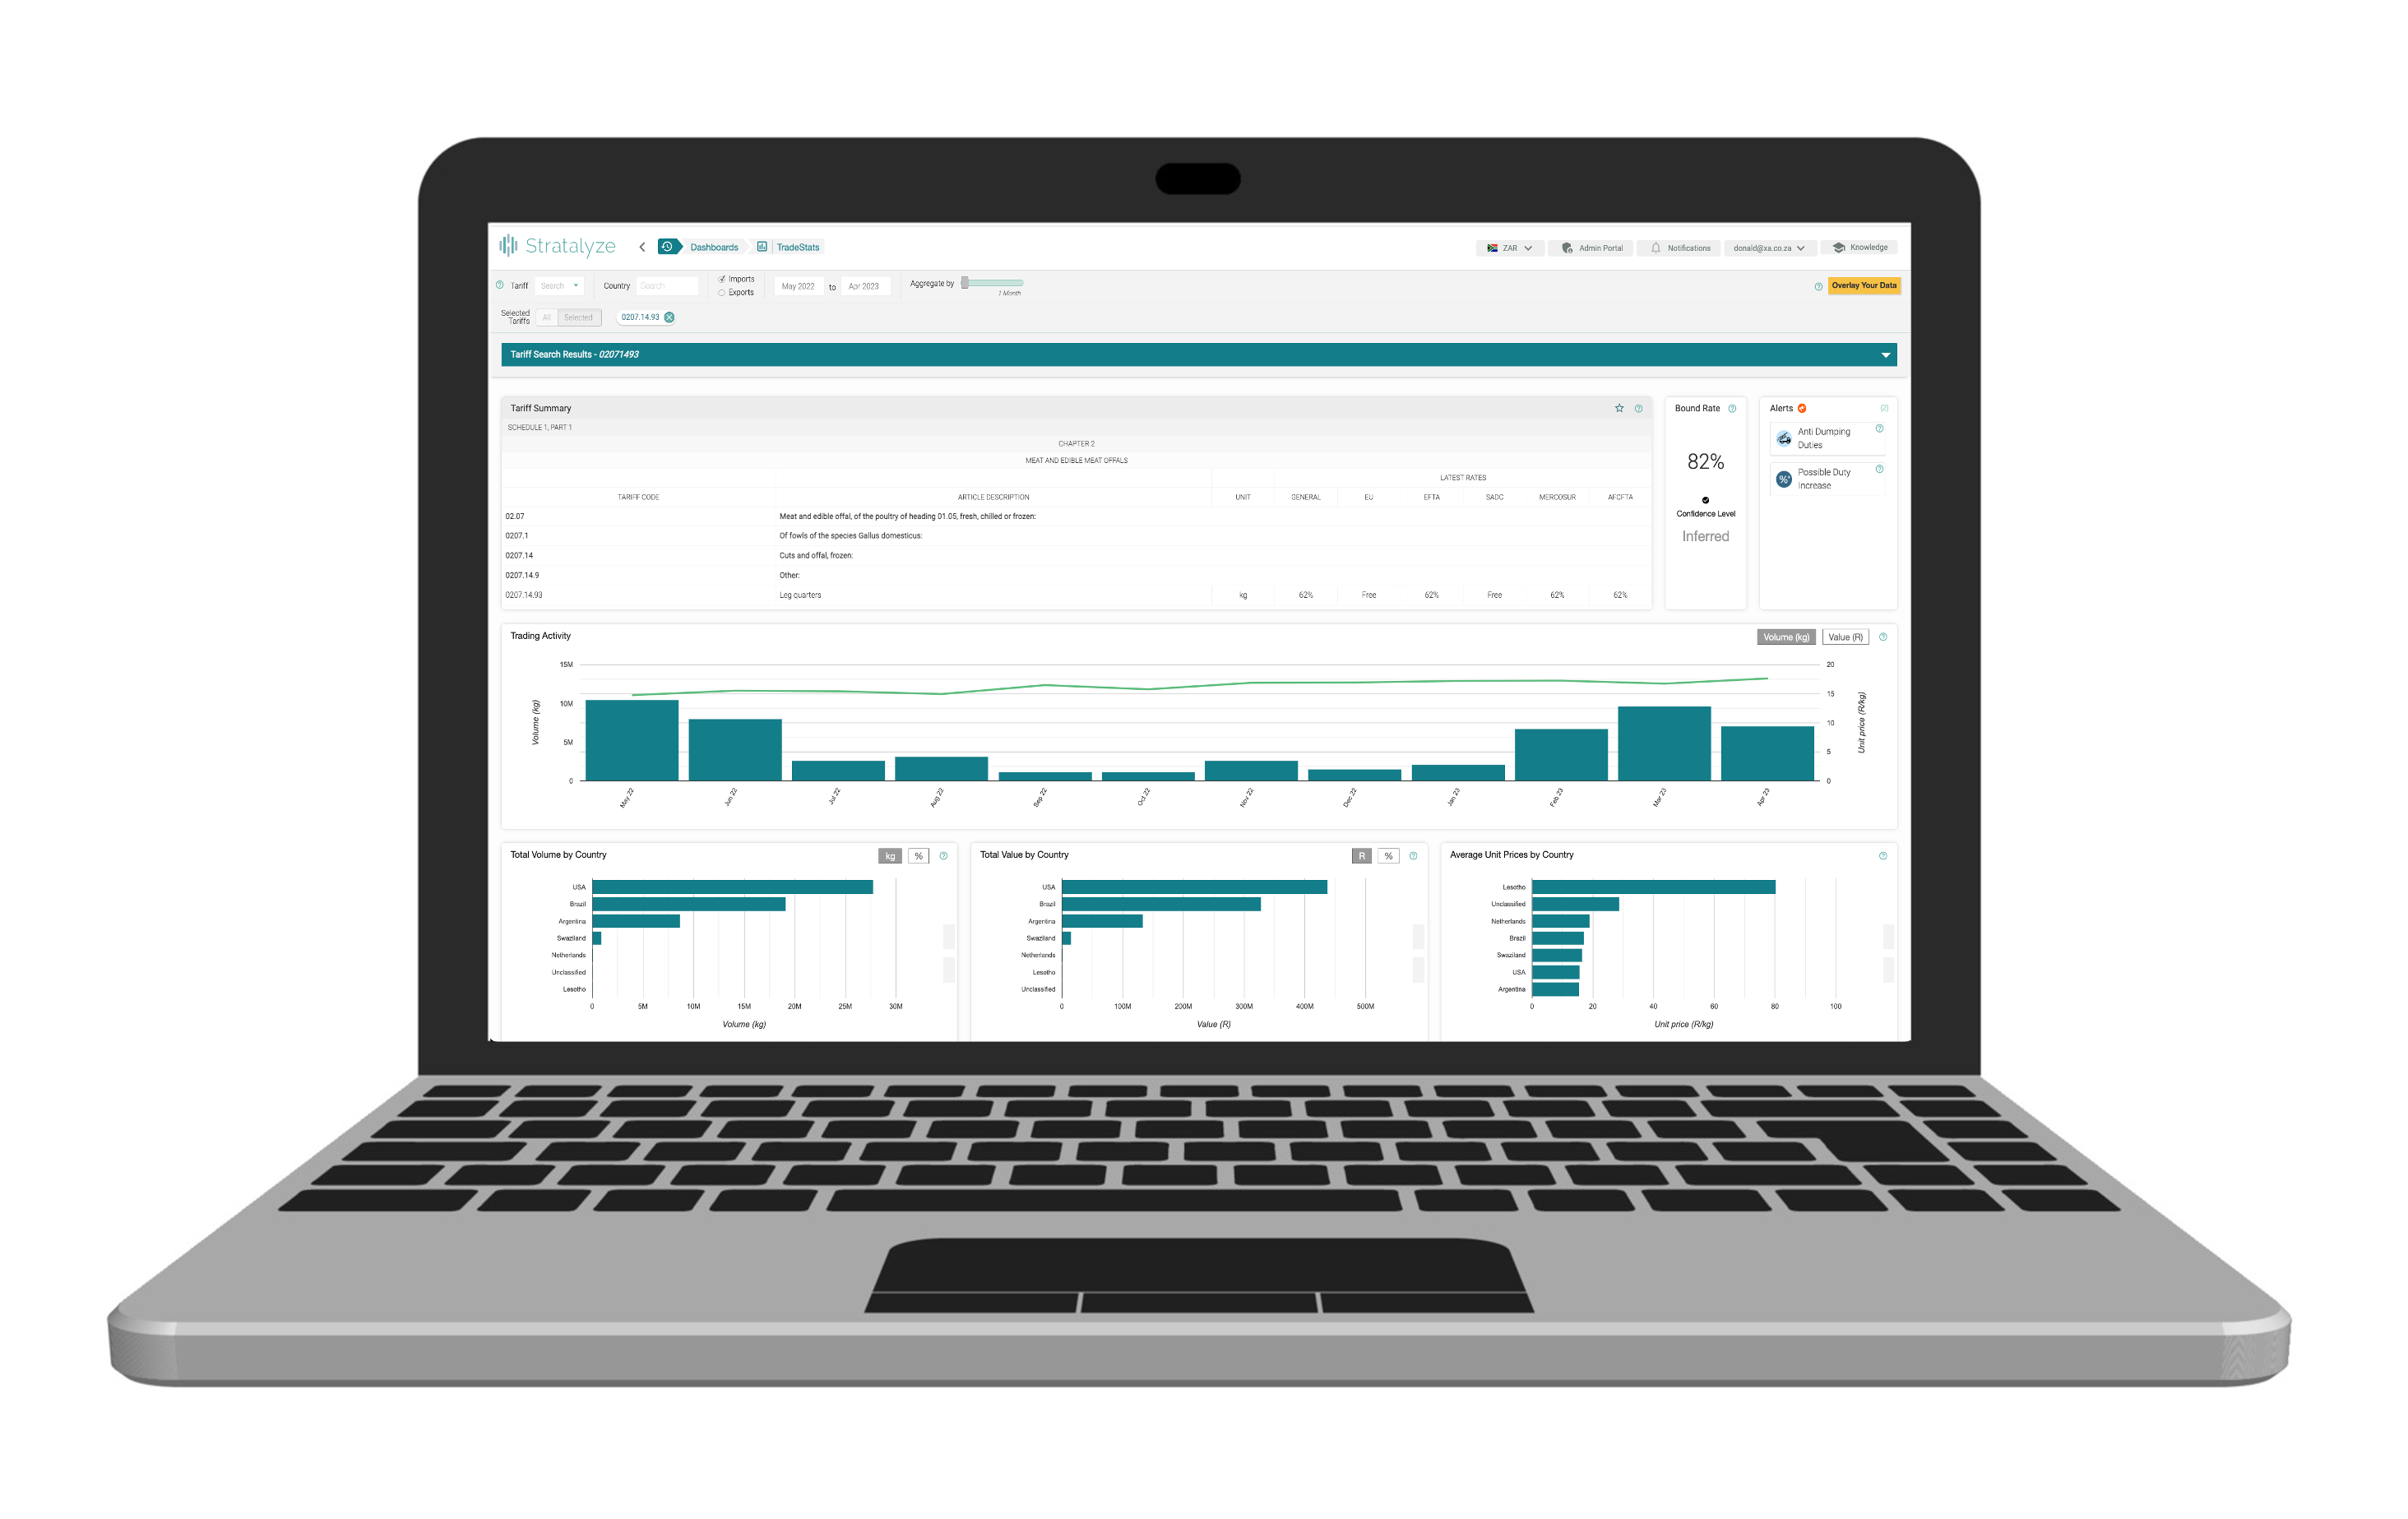
  • Browse the latest tariff book and view duty rates.
  • Benchmark your trading activity against the market.
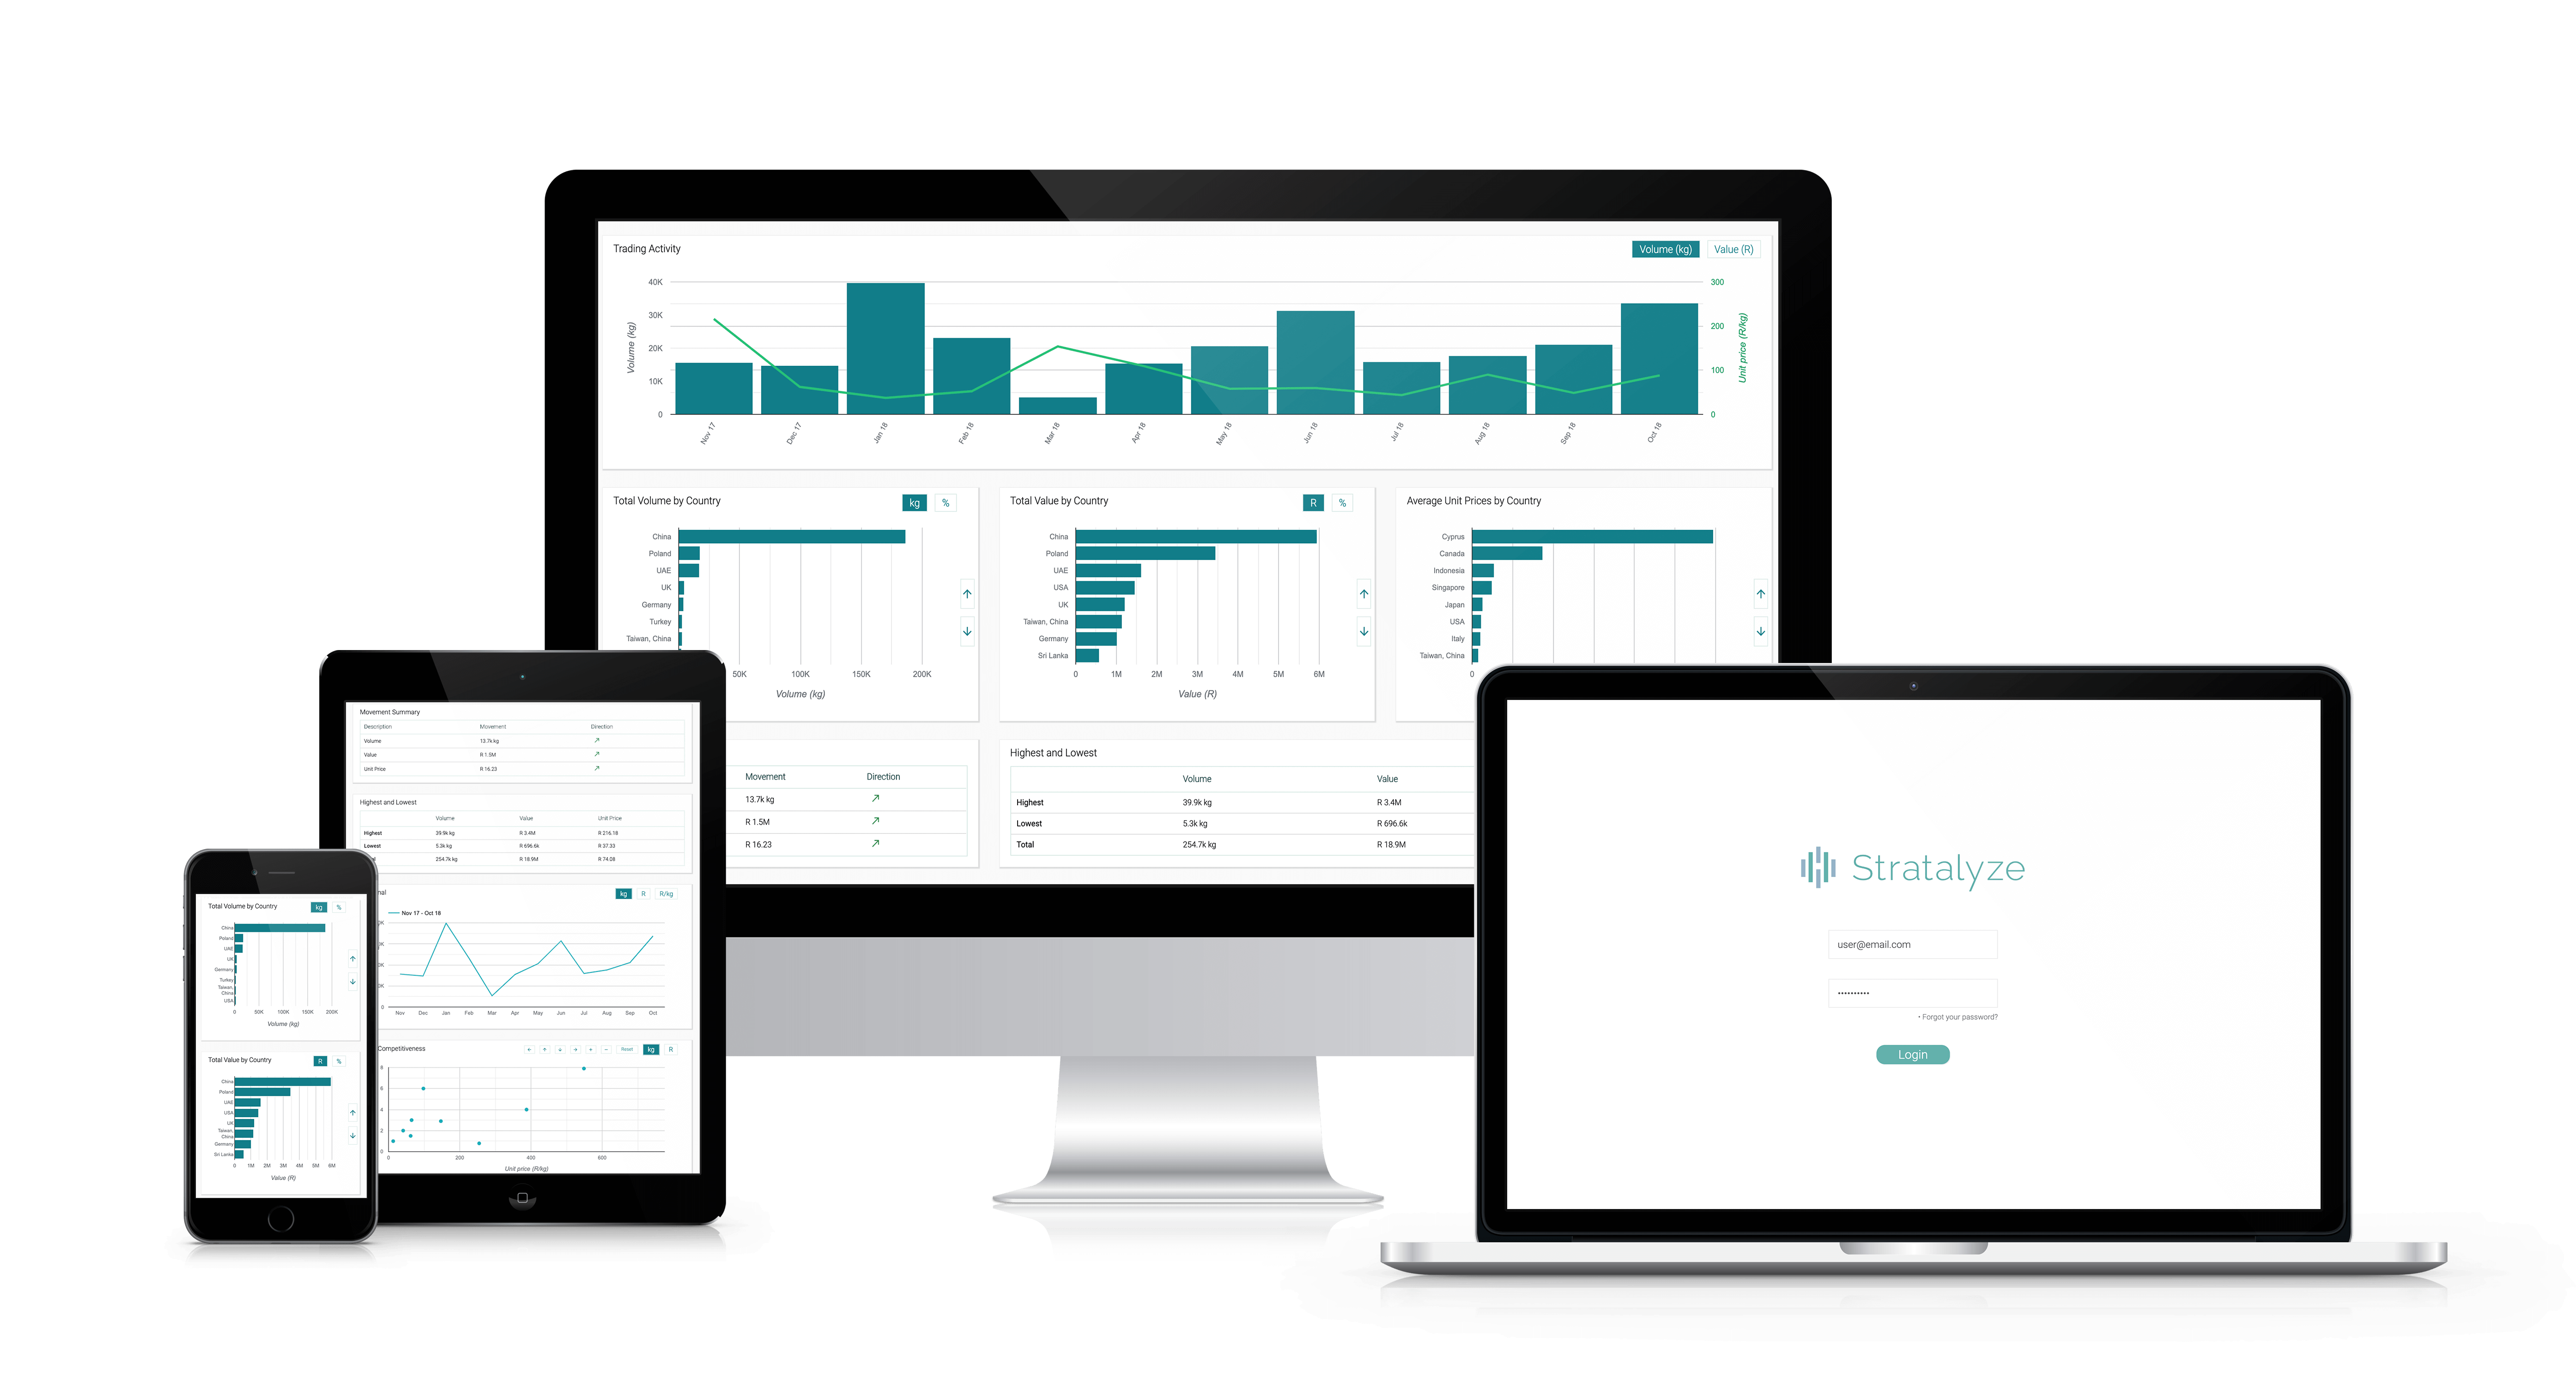
  • View trading activity per period.
  • Compare total value, volume and unit price by country.
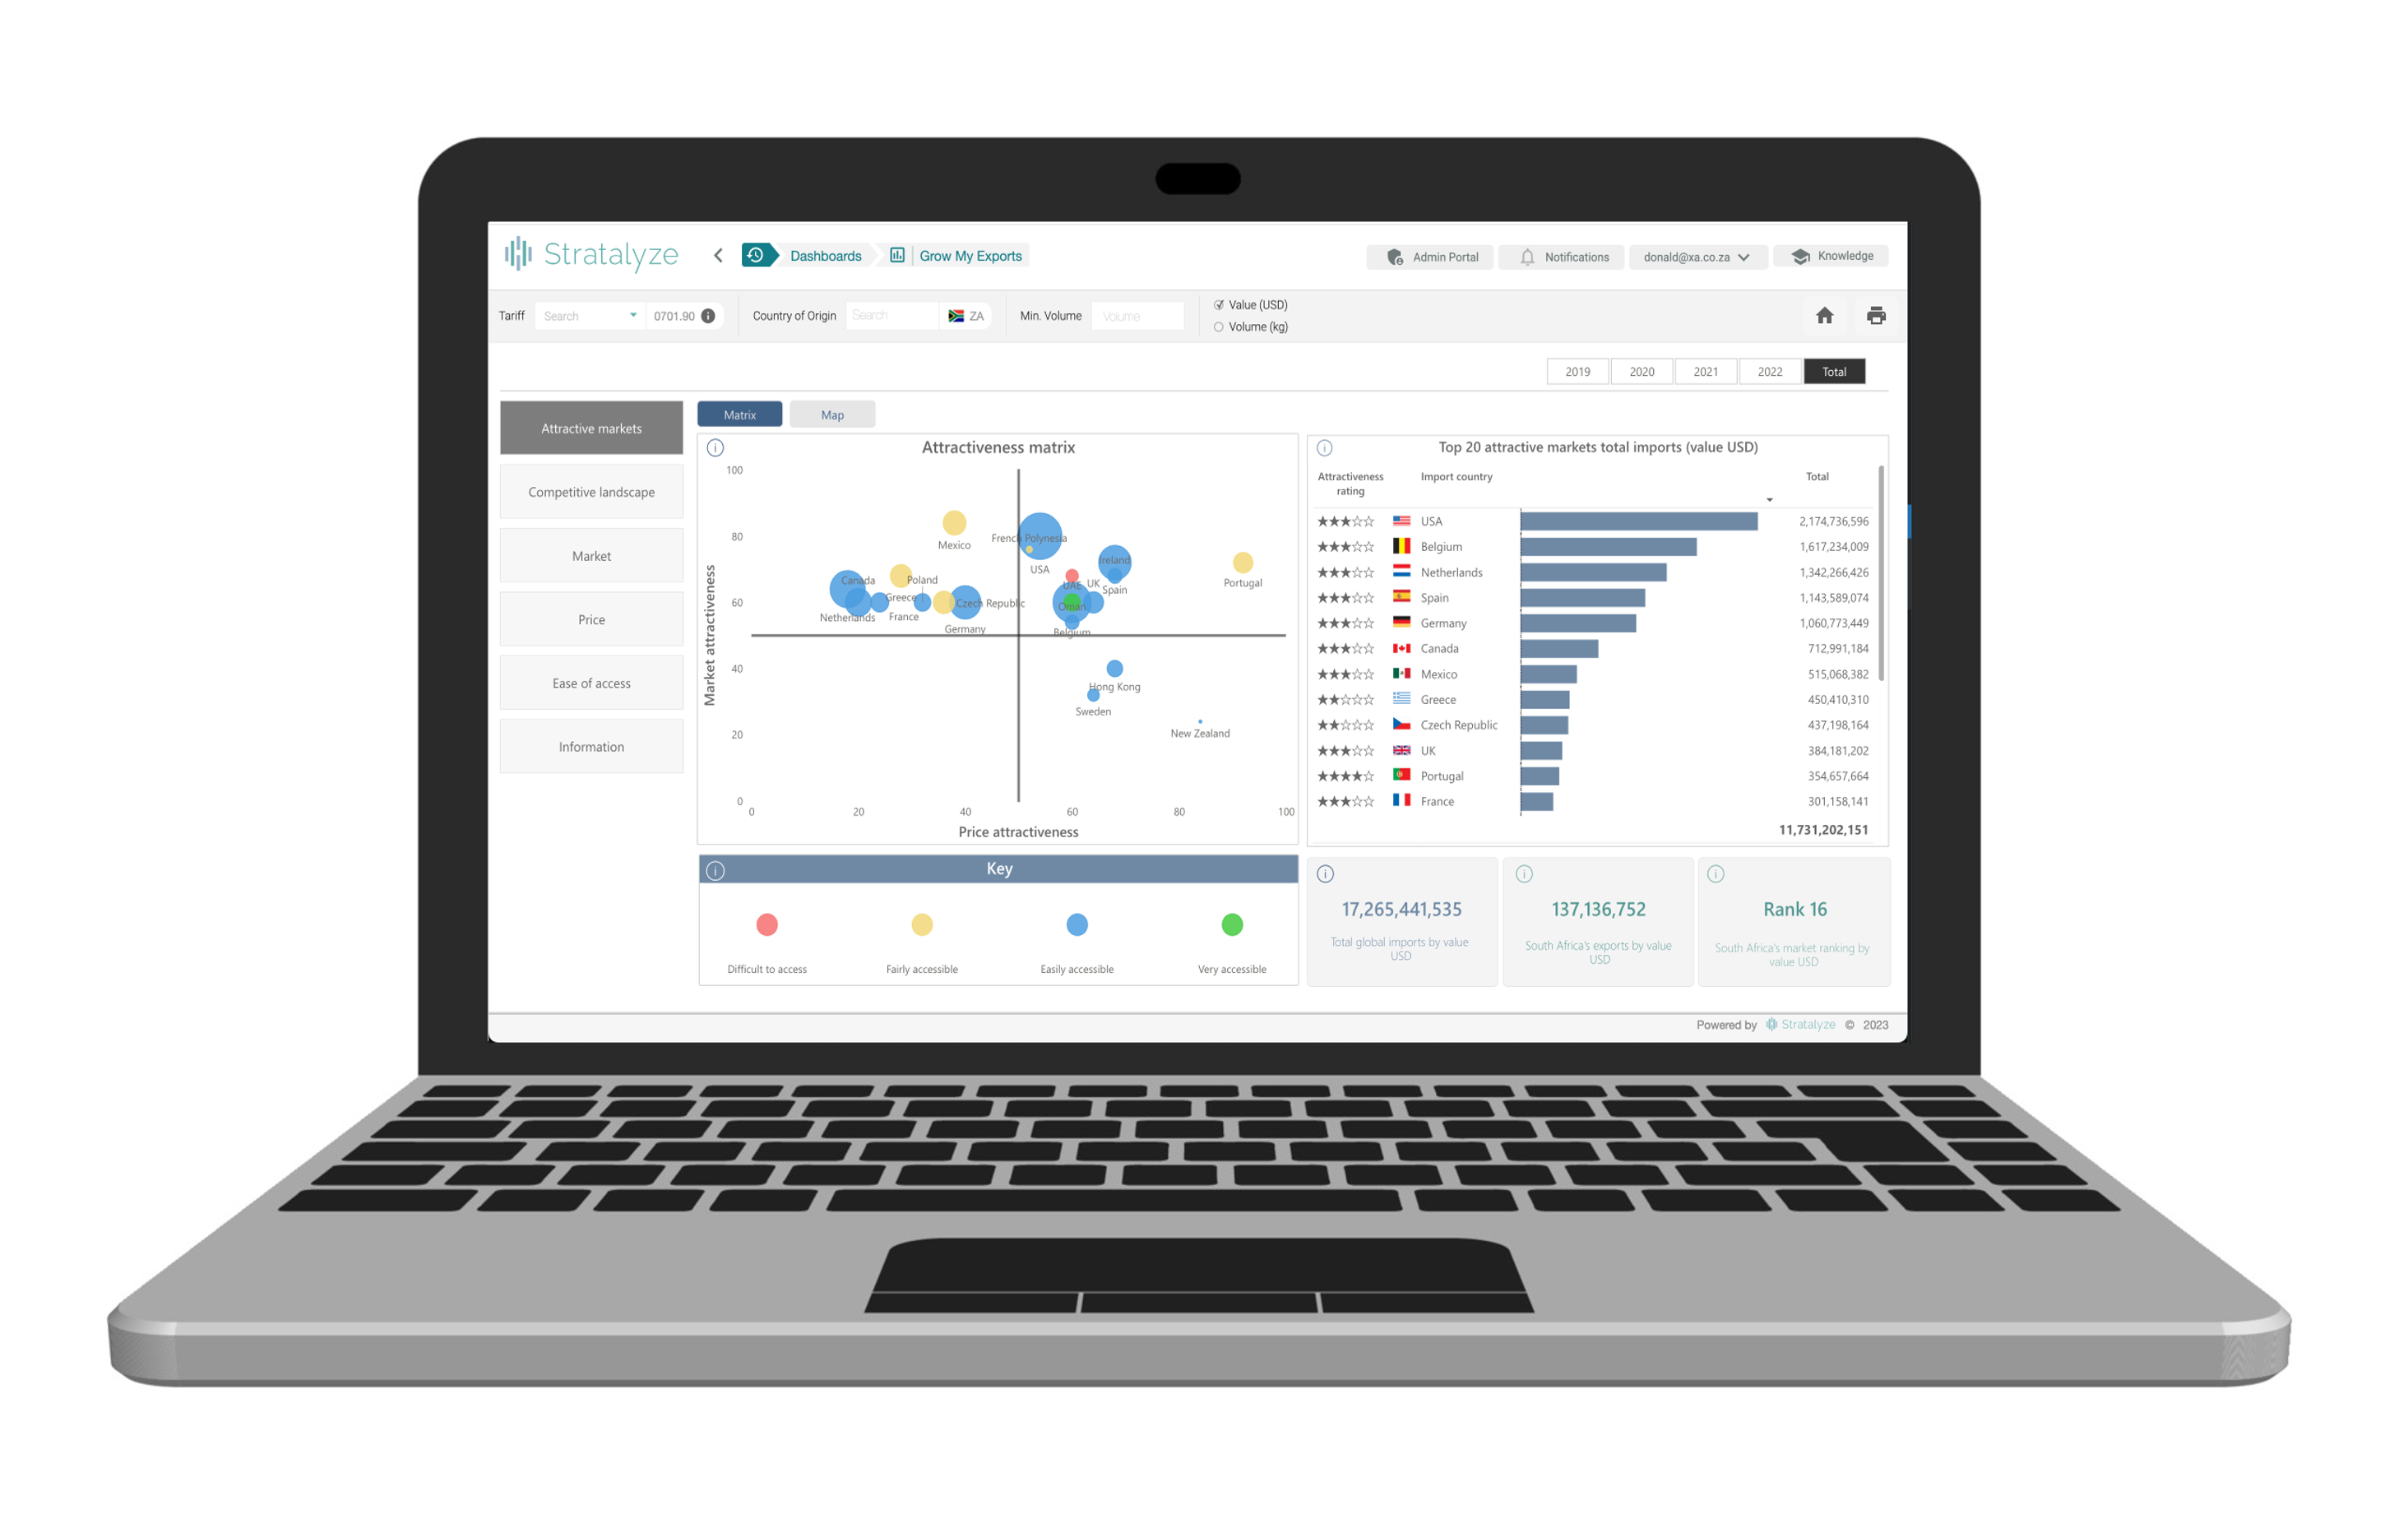
  • Assess trade competitiveness.

Stratalyze raises the bar for local and international trade data analysis.

Stratalyze raises the bar for local and international trade data analysis.

Features

Latest tariff book

Access the latest version of the SARS tariff book. View customs duties for each region we have trade agreements with.

Intelligent tariff searches

Locate tariffs using our powerful natural language interpreter and search engine.

Cross-border trend detection

Identify trends within the market, using powerful aggregation features.

Market share visualisation

Compare market share by country. Benchmark by volume, value and unit price.

Convenient sorting & filters

Focus on countries of interest, view values as percentages and change the order of results.

Responsive design

Use Stratalyze on your mobile, tablet, or a traditional device such as your laptop or computer.

Seasonal view

This view enables you to identify the times of the year when it is best to buy or sell your product.

Assess trade competitiveness

Determine how competitively goods are being traded by seeing the interplay between the volume traded and the prices obtained for products.

View your own data

Benchmark your own import and export trade data against the market. Assess how competitive you are compared to other traders.

We need your permission to obtain your data from SARS.

Extensive historical data

We have granular data dating all the way back to 2010. Let us take the hassle out of working with such a large data set.

Granular data extracts

Available on request. Let us remove the inconvenience of you having to obtain this data yourself.

COMING SOON: We will be releasing a feature that enables you to request data directly from within Stratalyze.

Regular feature releases

We have built our system to support releases of new features and content on a regular basis. No need to install a new version of our application. Updates will automatically appear within the application.

Subscription Plans

Standard Plan 1st Seat

R 15 420
(excl VAT) per annum
Tariff book searches
Trading activity per period
Trading volume & value per country
Average unit price per country
Seasonal view
Trade competitiveness

Standard Plan Seat+

R 11 940
(excl VAT) per annum
Tariff book searches
Trading activity per period
Trading volume & value per country
Average unit price per country
Seasonal view
Trade competitiveness

Trader Benchmarker Plan 1st Seat

R 34 800
(excl VAT) per annum
STANDARD PLAN REQUIRED
View your trade data
Benchmark against the market
Assess buying & selling effectiveness
POWER OF ATTORNEY required permitting us to obtain your data from SARS

Trader Benchmarker Plan Seat+

R 29 850
(excl VAT) per annum
STANDARD PLAN REQUIRED
View your trade data
Benchmark against the market
Assess buying & selling effectiveness
POWER OF ATTORNEY required permitting us to obtain your data from SARS

Standard Plan 1st Seat

R 15 420
(excl VAT) per annum
Tariff book searches
Trading activity per period
Trading volume & value per country
Average unit price per country
Seasonal view
Trade competitiveness

Trader Benchmarker Plan 1st Seat

R 34 800
(excl VAT) per annum
STANDARD PLAN REQUIRED
View your trade data
Benchmark against the market
Assess buying & selling effectiveness
POWER OF ATTORNEY required permitting us to obtain your data from SARS

Standard Plan Seat+

R 11 940
(excl VAT) per annum
Tariff book searches
Trading activity per period
Trading volume & value per country
Average unit price per country
Seasonal view
Trade competitiveness

Trader Benchmarker Plan Seat+

R 29 850
(excl VAT) per annum
STANDARD PLAN REQUIRED
View your trade data
Benchmark against the market
Assess buying & selling effectiveness
POWER OF ATTORNEY required permitting us to obtain your data from SARS

Standard Plan 1st Seat

R 15 420
(excl VAT) per annum
Tariff book searches
Trading activity per period
Trading volume & value per country
Average unit price per country
Seasonal view
Trade competitiveness

Standard Plan Seat+

R 11 940
(excl VAT) per annum
Tariff book searches
Trading activity per period
Trading volume & value per country
Average unit price per country
Seasonal view
Trade competitiveness

Trader Benchmarker Plan 1st Seat

R 34 800
(excl VAT) per annum
STANDARD PLAN REQUIRED
View your trade data
Benchmark against the market
Assess buying & selling effectiveness
POWER OF ATTORNEY required permitting us to obtain your data from SARS

Trader Benchmarker Plan Seat+

R 29 850
(excl VAT) per annum
STANDARD PLAN REQUIRED
View your trade data
Benchmark against the market
Assess buying & selling effectiveness
POWER OF ATTORNEY required permitting us to obtain your data from SARS

Frequently Asked Questions

We obtain South African import and export customs data from SARS on a monthly basis. The data is validated, reorganised and subjected to several proprietary algorithms before being made accessible to you though Stratalyze.

SARS audits the data before releasing it into the market. However, errors do occur and if we pick them up, we notify SARS. Individual traders and clearing agents also regularly post corrections to their historical data and we receive these corrections going back to years with each month’s dataset from SARS.

SARS releases trade data on a monthly basis. Each release covers data for the most recent period, plus all corrections for the preceding 23 months.

There is a delay of approximately 5 weeks between data being captured by SARS and this data being released to the market. For example, you will get August’s data around the beginning of October.

No, everything runs directly within the browser on devices such as your computer, phone or tablet. Stratalyze has been built using standard web technologies, and as such is supported by modern browsers such as Chrome, Safari, and Edge.

Please do not hesitate to contact our support team at support@stratalyze.com. There are several reasons why you may be unable to access our application, let our team assist. For example, our site may be blocked within your organisation, or you may be using an outdated version of Stratalyze.

Contact Us

Office Number

+27 (0) 12 665 1271

Address

Lower Ground Floor Building 4
Manhattan Office Park, Pieter Street
Highveld Technopark
Centurion

Sales

sales@stratalyze.com

Support

support@stratalyze.com